Mapping MTConnect Streams for Dashboard Visualization

Most manufacturing facilities run MTConnect agents on their CNC machines, but the XML data these agents produce isn't directly usable. You receive streams of timestamped measurements, state changes, and condition flags wrapped in hierarchical XML structures. Converting this into a functional dashboard means solving three problems: retrieving the data reliably, parsing it correctly, and routing specific values to the right display components.
This article walks through the implementation. You'll connect FlowFuse to an MTConnect agent, extract data items from the XML response, and build dashboard widgets that update in real time.
What MTConnect Is and Why It Matters
MTConnect is an open manufacturing standard that defines how equipment communicates operational data. Before MTConnect, each machine tool manufacturer used proprietary protocols. Connecting a Mazak, Haas, and DMG MORI to the same monitoring system meant writing custom integrations for each brand. MTConnect solves this by providing a vendor-neutral protocol that any machine can implement.
The standard specifies what data machines should report and how to structure it. A spindle speed reading from a Haas looks identical to one from a Mazak when both machines run MTConnect agents. This standardization makes it possible to build dashboards and monitoring systems that work across mixed machine fleets without custom code for each manufacturer.
MTConnect agents typically run as software on the machine controller or on a separate computer connected to the machine. The agent reads data from the controller's internal systems and exposes it through HTTP endpoints that return XML. You don't interact with the machine directly—you interact with the agent.
Data Types in MTConnect
MTConnect organizes data into three categories:
- Samples - Continuous numeric measurements like spindle speed, axis position, temperature, power consumption. These values change smoothly and have units.
- Events - Discrete state changes like mode switches, program starts, door opens. Values are strings or enumerations.
- Condition - Equipment health at component level: normal, warning, fault, unavailable. Multiple conditions can be active simultaneously.
Agents expose this through HTTP endpoints. /current returns latest values for all data items. /sample?from=X&count=Y returns time-series data.
XML Response Structure
Query /current and you get XML structured around machine hierarchy. A Streams container holds DeviceStream elements for each device. Each device contains ComponentStream elements for components like spindles and axes. Inside components sit the actual data—Samples, Events, and Condition elements.
Every data item has a dataItemId attribute for identification, a timestamp for when it was recorded, and the value as text content:
<SpindleSpeed dataItemId="S1spd" timestamp="2026-01-30T14:23:17.492Z">2847</SpindleSpeed>This hierarchy represents machines comprehensively but creates work for dashboard builders. You navigate multiple nesting levels, match data item IDs to values you need, and handle items missing from responses when they haven't updated since the last poll.
Getting Started
Now that we understand the structure of MTConnect and the challenges involved, let’s look at how to collect and visualize MTConnect data using FlowFuse.
FlowFuse is an industrial application platform built on Node-RED that brings data collection, transformation, and visualization together in one place. Instead of writing custom integration code, you build flows visually by dragging, configuring, and connecting nodes, then deploying them—no separate tools required.
Prerequisites
Before you begin, you need:
- FlowFuse instance – An active FlowFuse account with an instance created and access to the Instance Editor (sign up at https://app.flowfuse.com and follow /docs/user/introduction/#getting-started-with-flowfuse)
- MTConnect agent – A CNC machine running an MTConnect agent or an MTConnect simulator such as the public agent at
agent.mtconnect.orgor a locally hosted agent - Network access – Connectivity from the FlowFuse instance to the MTConnect agent’s HTTP endpoint, with the FlowFuse Remote Device Agent installed when connecting from cloud-hosted FlowFuse to on-premises machines
Collecting MTConnect
Bringing MTConnect data into FlowFuse is the first step toward a live dashboard. The Solution Engine node (node-red-contrib-solution-engine) makes this easy because it lets you access any data point directly by its dataItemId, without having to worry about parsing XML or navigating nested structures.
You can install the node by following the instructions in the FlowFuse documentation: Using the Palette Manager.
Once installed, follow these steps to start collecting data:
-
Add the
mtconnect-dataitemnode to your canvas and open its configuration. -
Enter the host of your MTConnect agent or broker (for example,
mtconnect.isoc.net). -
Enter the port your agent is listening on (default for HTTP is usually
80, or443for HTTPS). -
Path (optional): leave this empty in most cases. The node automatically detects the type of agent or broker and chooses the correct endpoint:
- For SolutionEngine agents, it uses
/api/v6/mtc/current. - For generic MTConnect brokers like
mtconnect.isoc.net, it uses/current.
Only fill in this field if your broker uses a custom endpoint that differs from the defaults. Entering
/currentmanually for standard brokers may cause the node to fail. - For SolutionEngine agents, it uses
-
Enter the
dataItemIdfor the value you want to retrieve. -
Once everything is configured, deploy the flow.
To trigger the node, add an Inject node, set the polling interval you want, and connect it to the mtconnect-dataitem node. This will fetch the latest data at regular intervals and send it to your dashboard or other nodes in the flow.
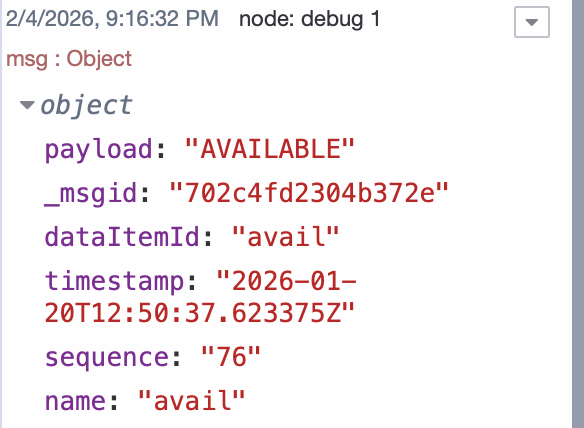
When the node successfully retrieves data, it outputs the following fields: msg.payload (the value), dataItemId, timestamp, sequence, and name. The node also shows the status with a green square when data is found successfully. If the value isn’t available, it will display a yellow square.

Building the Dashboard
Now that you’re successfully retrieving MTConnect data, the next step is to display it on a live dashboard. FlowFuse makes this straightforward with its dashboard package. You can bind any data item to a visual component, and it updates automatically whenever new data arrives.
Before you start, make sure to install the @flowfuse/node-red-dashboard package to add the dashboard nodes.
For this tutorial, we’ll use the public MTConnect agent at mtconnect.isoc.net to demonstrate how data flows into the dashboard. We’re not building a full dashboard here—just enough to get started and showcase a few key data points.
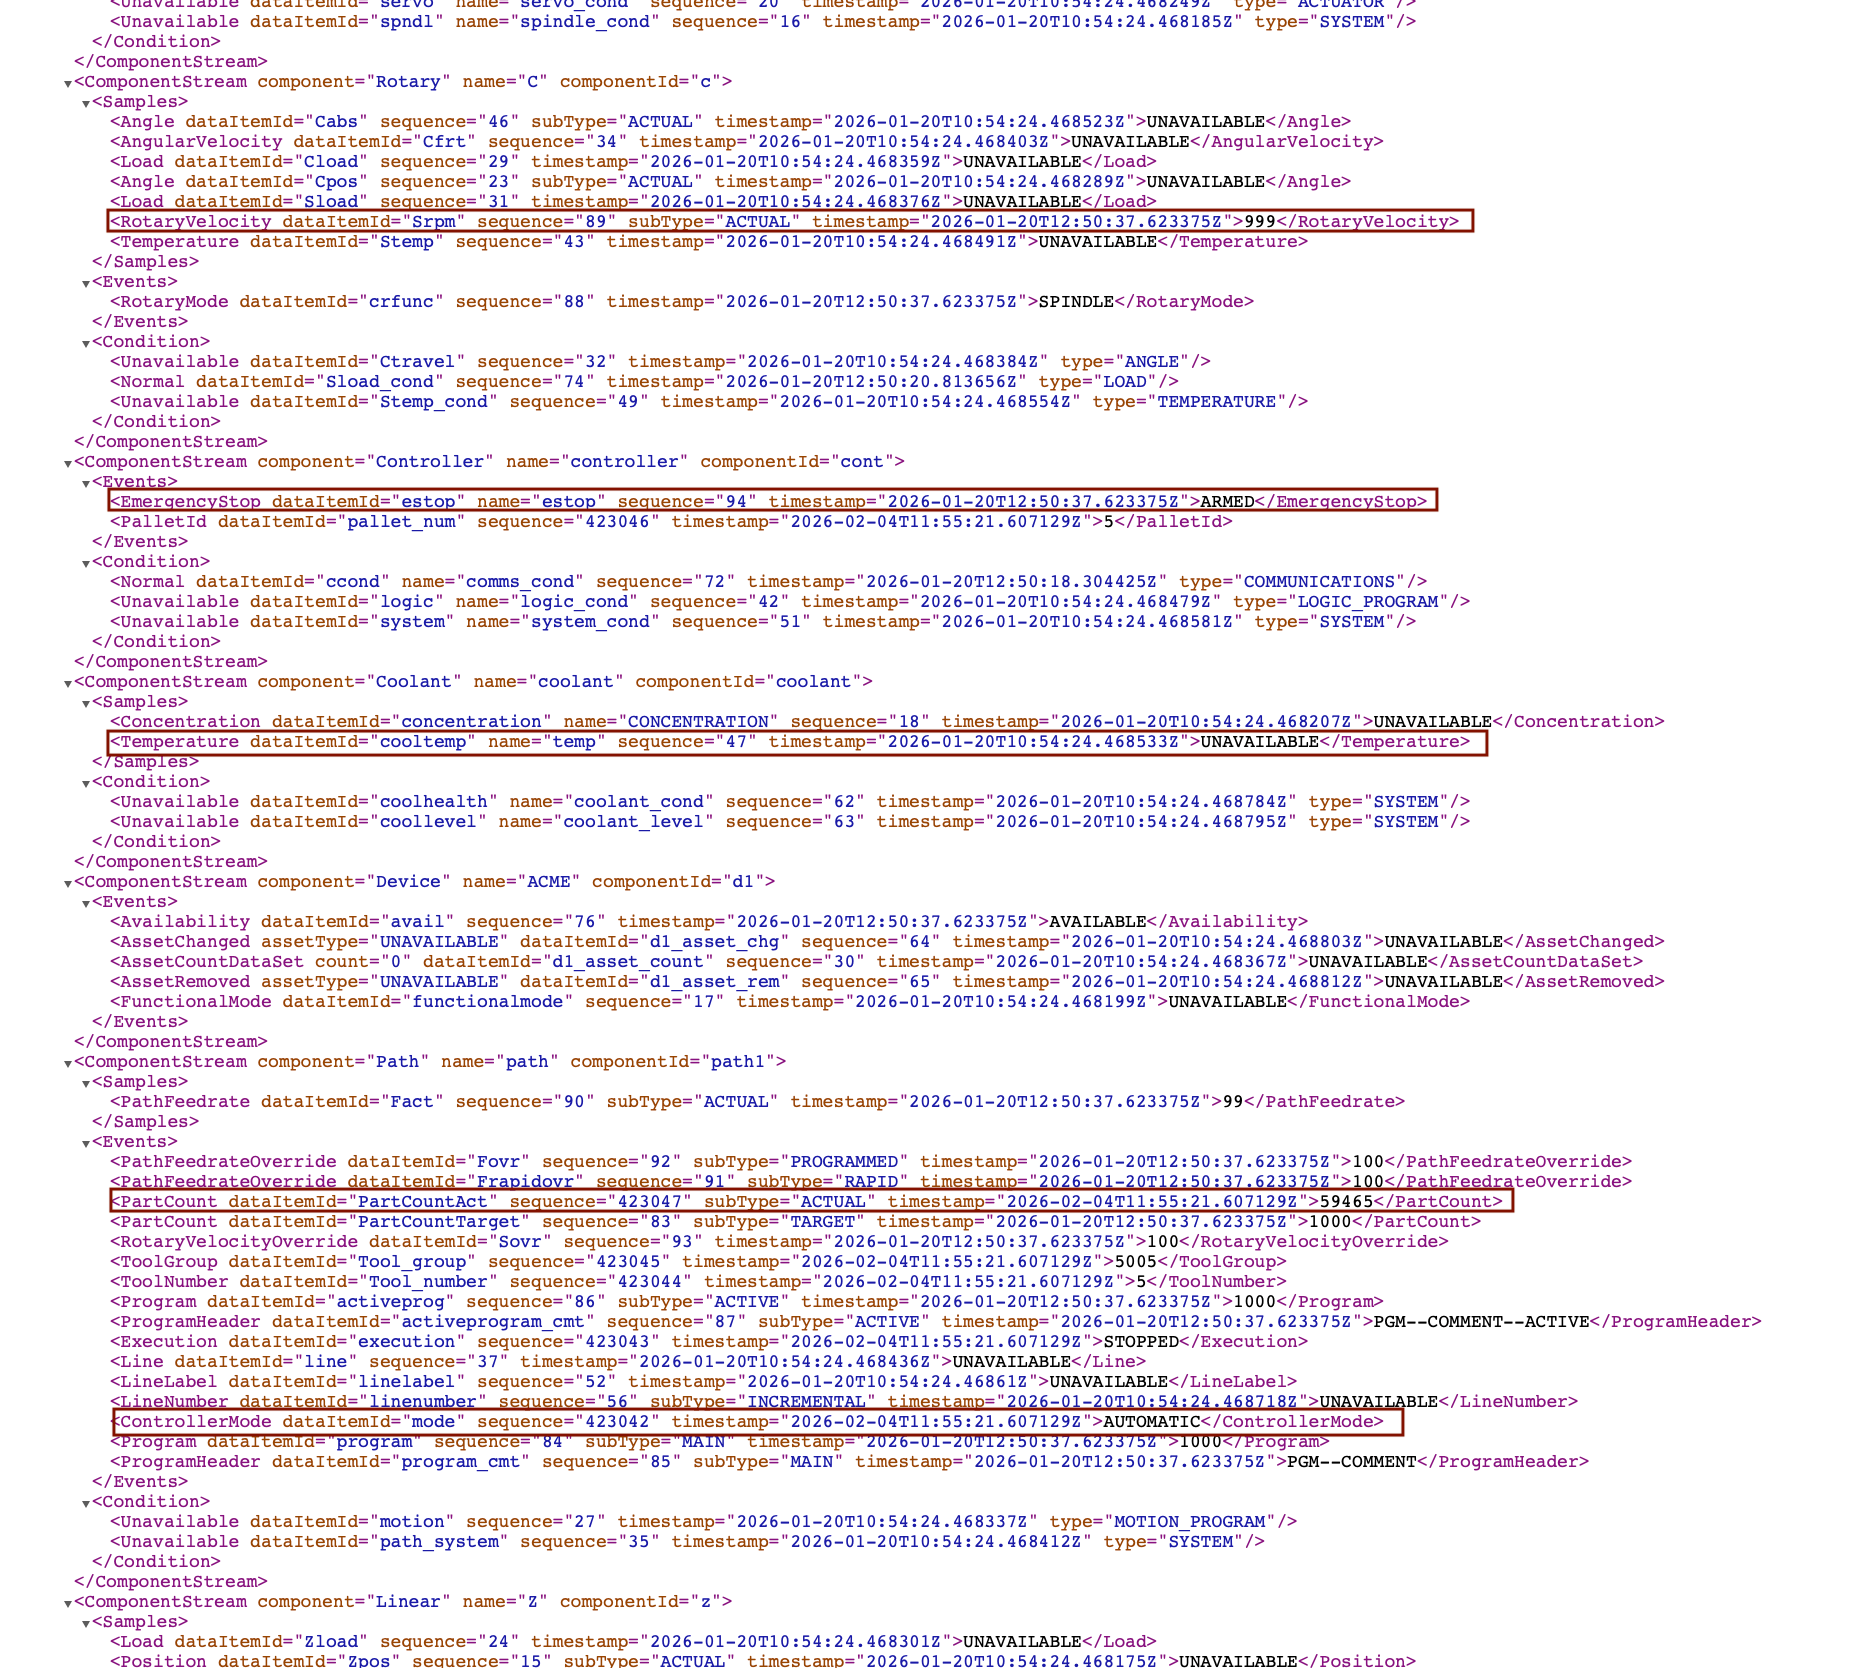
The five data points we’ll display are:
- Spindle Speed (
Srpm) – Shows the actual rotation speed of the spindle. - Controller Mode (
mode) – Displays if the machine is in automatic, manual, or idle mode. - Part Count (
PartCountAct) – Tracks the number of parts produced. - Emergency Stop Status (
estop) – Indicates whether the E-stop is active. - Coolant Temperature (
cooltemp) – Monitors the coolant system temperature.
Looking at the XML response, these values are located in different ComponentStream elements. If you open the XML, you’ll notice that I’ve marked the tags in red boxes for clarity:

About the Author
Sumit Shinde
Technical Writer
Sumit is a Technical Writer at FlowFuse who helps engineers adopt Node-RED for industrial automation projects. He has authored over 100 articles covering industrial protocols (OPC UA, MQTT, Modbus), Unified Namespace architectures, and practical manufacturing solutions. Through his writing, he makes complex industrial concepts accessible, helping teams connect legacy equipment, build real-time dashboards, and implement Industry 4.0 strategies.
Related Articles:
- Agentic AI Reads OPC UA Servers So You Don't Have To
- Why Modbus Refuses to Die
- MQTT vs OPC UA: Why This Question Never Has a Straight Answer
- Beyond Kepware: Why Modern Industrial Connectivity Demands a Second Look
- FlowFuse 2.26: Bringing access-controls to your MCP nodes